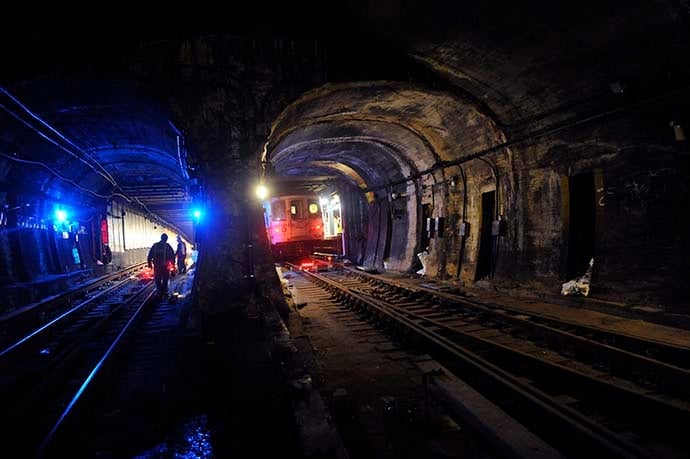
Here Be Dragons
In New York City, 8.5 million people live and work in 304 square miles of land. Imagine all the gas, electrical, trains, sewer, water, and other things that make it possible for people to live, eat, work, and play there. Surprisingly, there isn’t one single map that details where everything is located. Parts of the city are like fairy tale maps with “here be dragons” on it.
September 11, 2001 and Hurricane Sandy in 2012 made clear the city needs a single map that shows everything so people can plan and avoid disasters like breaking gas lines and hurting people.
So New York City is developing a single map using Global Information Systems (GIS). The link below will bring you to the article, where you can learn how the depth of pieces of the city is determined, and other interesting details.
https://www.bloomberg.com/news/ features/2017-08-10/nobody-knows-what-lies- beneath-new-york-city
Space Art
Astronomers find habitable planets with their telescopes, but how do you know what these planets and solar systems actually look like?
A visualization scientist at NASA translates data from these planets into pictures we can recognize as planets and stars. We’ll never know for certain if these pictures match the reality, but they give us a way to understand what distant habitable planets might look like.
When planets were discovered around a star called TRAPPIST-1, NASA visualization scientist Robert Hurt got the assignment to create visual images. TRAPPIST-1 is a dim red star about 40 light years from us and has seven earth-sized planets that rotate closely around it.
Hurt and a colleague, Tim Pyle, a multimedia producer, created a series of amazing photorealistic images of the TRAPPIST-1 planets. Their images were based on data extracted from telescopes. This is called space art. Early on, scientists wanted to convert their data into images to better understand it. And space programs like NASA realized visual images got the public excited and supportive of their missions.
Artists imagine what alien worlds look like based on real data, for example, guring out at which angle a planet might be relative to its sun and the sky color based on the chemistry of the planet’s atmosphere.
So the next time you’re outdoors at night and look up to see the
moon, imagine what it might look like to be on a planet flying around
the TRAPPIST-1star. Could you see the other six planets? Maybe!

