
If you’ve ever used programs like Adobe Illustrator or Inkscape, then you’ve definitely worked with the scalable vector graphics (SVG) image format. What you may not have realized is that it’s actually a very simple, well-defined file format that programmers can easily work with to programmatically generate images or to create interactive graphics.
Now, there’s two basic ways you can store images on a computer. You can either encode what each individual pixel looks like in the image—which is what happens in image formats like GIF, JPEG, BMP, PBM, and PNG—or you can have a high level encoding that describes what should be drawn but not how the pixels look. The former are called raster graphics. The latter is how vector graphics work. So while in BMP a line might look something like
P1

10 10

1 1 0 0 0 0 0 0 0 0

1 1 1 0 0 0 0 0 0 0

0 1 1 1 0 0 0 0 0 0

0 0 1 1 1 0 0 0 0 0

0 0 0 1 1 1 0 0 0 0

0 0 0 0 1 1 1 0 0 0

0 0 0 0 0 1 1 1 0 0

0 0 0 0 0 0 1 1 1 0

0 0 0 0 0 0 0 1 1 1

0 0 0 0 0 0 0 0 1 1
In SVG, the same small line would look like
<svg xmlns=”http://www.w3.org/2000/svg”>
  <line x1=”0” y1=”0” x2=”10” y2=”10”  stroke-width=”2” stroke=”black” />
</svg>
As you might see from the above example, SVG has a simple HTML-like syntax. Technically speaking, SVG is an example of an XML file format. XML being a very restrictive, but simple, way of writing files brought to us by the World Wide Web Consortium (W3C), the same international body that defined how things like HTML and CSS should work. It’s meant to look like HTML but with different tags instead.
While in the human readable PBM format you can see the shape of the line, in the SVG format you can see that there’s literally a line described in terms of it starting point, ending point, and color.
Raster formats, where you’re describing the image pixel-by-pixel, have more flexibility than vector graphics, but have the disadvantage of not being able to be easily written or read by a person. The other advantage that vector graphics have is that they’re easily scaled to different sizes because they have enough structure.
The big disadvantage of a format like SVG is that rather than dealing with a paintbrush you can move any way you like, it’s a bit more like sticking lego blocks together. You can still do a lot of amazing things, but sometimes you’ll have to work a bit to get exactly what you’re looking for.
This is why applications like MS Paint feel so different than something like Adobe Illustrator. MS Paint allows you to create raster images by drawing all over the pixels however you want. Illustrator and Inkscape do a fair bit of work to allow you to do “free drawing”. If you have Inkscape, try using the calligraphy brush and drawing, then save the file and open it in a text editor: you’ll see all the fine curves and lines that go into the illusion of free hand drawing.
We’ve said that SVG images are made from a basic set of building blocks. Roughly speaking, those building blocks are
- lines
- circles
- ellipses
- rectangles
- general curves
- text
- imported images (usually raster)
all of these follow a pretty similar pattern in how they’re used: there’s a tag name which describes the kind of shape and then the details of the shape—color, size, starting and ending points, etc.— are given in the attributes of the tag.
So above we saw an example of a line in SVG
<svg xmlns="http://www.w3.org/2000/svg">
  <line x1="0" y1="0" x2="10" y2="10"
	stroke-width="2" stroke="black" />
</svg>
We can break down the attributes involved:
- x1 is the starting x position
- y1 is the starting y position
- x2 is the ending x position
- y2 is the ending y position
- stroke-width is how many pixels wide the line should be
- stroke defines the color
Although, there’s another detail we need to discuss: what x and y coordinates even mean here. Maybe you’ve seen in math classes where the origin is the center of the graphic at (0,0).
On the other hand, in SVG and a lot of other computer image and video game engine contexts, the point (0,0) corresponds to upper left hand corner. Go ahead and type a slight variation of the above into a file, with the extension .svg, and then open either in your browser or an image editing program.
<svg xmlns="http://www.w3.org/2000/svg">
  <line x1="0" y1="0" x2="200" y2="200"
	stroke-width="5" stroke="black" />
</svg>
You should see that the line starts in the upper left hand corner and ends in the lower right hand corner.
Similarly, if you want to make a circle you can do something like
<svg xmlns="http://www.w3.org/2000/svg">
  <circle cx="100" cy="100" r="40" stroke-width="3" stroke="black" fill="none"/>
</svg>
As an exercise: try making an image that will be the universal “not allowed” symbol, a red circle with a red line crossing through the center of the circle starting in the upper left and going down through the lower right.
Python
While being able to write pictures like you would write web pages or programs is pretty neat, the biggest advantage is that you can easily generate SVG images programmatically.
For the next couple of examples, we’ll be showing the Python library svgwrite, which is a light-weight library for making SVG images. You should be able to find similar libraries for your favorite programming language, too.
As a first example,
import svgwrite
draw = svgwrite.Drawing(filename=”test1.svg”)
draw.add(draw.circle(center=(100,100), r=100))
draw.save()
that just writes the data to create a circle in a file called test1.svg.
Here’s a slightly more complicated example to create circles randomly:
import svgwrite
import random
from random import randint
img = svgwrite.Drawing(filename=”circles.svg”)
numtimes = randint(10,50)
for i in range(0,numtimes):
    posx = randint(0,500)
    posy = randint(0,500)
    rad = randint(10,50)
    c = img.circle(center=(posx,posy),r=rad)
    img.add(c)
img.save()
Now whenever you run this code, you’ll get a new image of circles of varying sizes and positions. That was a pretty simple program!
Further examples are in a GitHub repository (https://github.com/clarissalittler/svg-examples) where there are programs for generating a simple fractal, making silly remixes of words as pictures, and things like that.
JavaScript
Beyond programmatically generating SVG images, which you can do in any language, there’s also making images interactive in the browser, which requires JavaScript.
JavaScript, if you haven’t ever used it, is the language every browser can execute in order to make webpages interactive. JavaScript talks to the browser through the Document Object Model (DOM), which lets the programmer interact with a representation of the webpage from the JavaScript code. The DOM is simply a map of all the parts that make up a web page. So, the same technology that allows for games and chat programs to work in the browser will also allow us to create interactive images.
The following JavaScript example creates a circle of a random radius in every place you click.
window.onload = function () {
    var xmlns = “http://www.w3.org/2000/svg”;
    var canvas = document.getElementById(“canvas”);
    canvas.addEventListener(“click”, function (e) {
	var xpos = e.clientX;
	var ypos = e.clientY;
	var newCirc = document.createElementNS(xmlns, “circle”);
	newCirc.setAttributeNS(null,”cx”,xpos);
	newCirc.setAttributeNS(null,”cy”,ypos);
	newCirc.setAttributeNS(null,”r”,Math.floor(Math.random() * 100));
	canvas.appendChild(newCirc);
    });
}
The full code is available at the svg-examples GitHub repo (https://github.com/clarissalittler/svg-examples).
Bonus exercise: modify the code from the above example so that the circles created when you click fall down the screen. Extra-bonus if they get faster as they fall, like in real life.
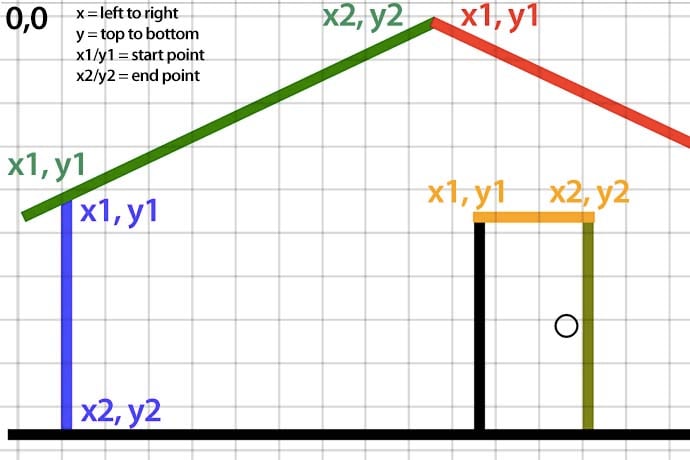
Finally, here’s the SVG code for the colored house shown on the previous page. Copy paste it into a text editor then open the file in a web browser.
<svg xmlns=”http://www.w3.org/2000/svg”>
<!-- door -->
	<line x1=”220” y1=”100” x2=”220” y2=”200” stroke-width=”5” stroke=”black” />
	<line x1=”270” y1=”100” x2=”270” y2=”200” stroke-width=”5” stroke=”olive” />
	<line x1=”217” y1=”100” x2=”273” y2=”100” stroke-width=”5” stroke=”orange” />
	<circle cx=”260” cy=”150” r=”5” stroke-width=”1” stroke=”black” fill=”none”/>
<!-- walls -->
	<line x1=”30” y1=”92” x2=”30” y2=”200” stroke-width=”5” stroke=”blue” />
	<line x1=”370” y1=”92” x2=”370” y2=”200” stroke-width=”5” stroke=”blue” />
<!-- ground -->
	<line x1=”3” y1=”200” x2=”400” y2=”200” stroke-width=”5” stroke=”black” />
<!-- roof line -->
	<line x1=”10” y1=”100” x2=”200” y2=”10” stroke-width=”5” stroke=”green” />
	<line x1=”198” y1=”10” x2=”390” y2=”100” stroke-width=”5” stroke=”red” />
</svg>
And here’s a fun silly image to copy paste into a text file to view in a web browser:
<svg xmlns=”http://www.w3.org/2000/svg”>
	<line x1=”120” y1=”240” x2=”250” y2=”240” stroke-width=”5” stroke=”red” />
	<circle cx=”100” cy=”100” r=”80” stroke-width=”3” stroke=”black” fill=”none”/>
	<circle cx=”158” cy=”100” r=”20” stroke-width=”3” stroke=”black” fill=”black”/>
	<circle cx=”270” cy=”100” r=”80” stroke-width=”3” stroke=”green” fill=”none”/>
	<circle cx=”212” cy=”100” r=”20” stroke-width=”3” stroke=”green” fill=”green”/>
</svg>
We’ve covered a lot of material in this tutorial, and there’s far more to cover on this topic, but hopefully we’ve given you some ideas to think about and inspiration for projects.